
When sales teams are not meeting their quota, management struggles with the following questions:
- Do we need to change the sales process?
- Do I need to do more tracking and inspection?
- Does the team need training?
- Are other business processes impacting sales?
In our previous blog posts, we took the first two steps and acknowledged there was a disconnect somewhere in our sales process and execution. We recommended that before you take action and spend money, you should map your value stream process and collect data on the activities in each phase of the process. Applying the Lean problem-solving procedures will save you money and help you identify the real cause of your lagging sales.
Analyzing Your Data
Remember also that I said it is essential to gather the right metrics at each phase of the sales process. You want to focus on the goal of closing sales, and you don’t want to frustrate or anger the sales team. Therefore, you want them involved in every step of the problem-solving process. Employee involvement is a key element in the success of your Lean journey. You want the sales team not only to take ownership of the solution but also to bring reality into the analysis. They must also understand that working through the analysis will help them develop and close more sales. As a result, they will earn more money with less frustration and effort.
DMAIC – Analyze Focus

Applying the discipline of analyzing the data will allow you to get to the root cause of the problem. This is critical to your success because if you apply a fix to a symptom, it does not prevent the problem from raising its ugly head again. With the cause identified, you can pilot and then implement improvements.
Since you have measured the data, it is now time to analyze your results. Let’s start by listing the four deliverables in the Analyze phase of problem-solving:
- Documentation of the possible causes
- Charts and other forms to show the link between the cause and the result
- Identification of the value-add, non-value add, and non-value add but necessary work
- Calculation of the process efficiency.
Documentation of Possible Causes
Your metrics for each phase should show the problems in each area of the value stream and indicate how often the problem occurred. Your team can create a Pareto chart to display the problems. Because there are so many areas that can be improved, the Pareto chart will help you categorize and group the problem metrics. Usually, you will find that relatively few problems of significance cause a large percentage of errors or unsatisfactory results. Graphically displaying them in colored bars will allow the significant problems to stand out from the rest of the issues.
Pareto Chart
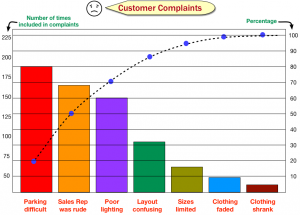
Ensure when you are charting them that you try to group them as much as possible. Decide on a time frame and a scope of the problem area you wish to address. You may want to organize by frequency, cost, or time. Calculate the totals by dividing the metric for each problem by the total. Then, arrange the bars on the chart to represent the problems with the highest percentage on the left moving to the lowest percentage on the right. Be sure to title your chart and insert your number and groupings. Once your chart is complete, choose to improve the problem that will have the most significant impact on the results and the customers. The chart will serve as a guide for your next problem to solve or process to improve.
Cause and Effect Diagrams
Now that your chart is complete and you have selected the problem you want to attack, it is time to search for and analyze the possible cause or causes. You can use the Ishikawa Diagram to help you get to the root cause quickly and accurately. This diagram is usually called the fishbone diagram as it resembles the skeleton of a fish. The head of the fish is where you document the problem. There are typically 6 bones which represent the cause categories.
Ishikawa Fishbone Diagram

When manufacturing companies create a fishbone diagram, the bones are labeled with the 6M categories: man (people), machine, material, method, measure, and mother nature. We will use the 6 Ps to label the bones as these have been developed by companies applying Lean to the office. The 6 Ps are policy, process, people, plant, program, and product. Let’s explore the 6 Ps for a minute to see how they relate to the sales process:
- Policy: Policy impacts the ability of the sales rep to be flexible in elements such as in pricing, configuration, and delivery schedules and costs
- Process: The sales process can be formal or informal. The management can inspect and coach to ensure adherence to the process, or they can allow each rep to use their own process. Problems in this area are an indication that a sales process and/or CRM process is required. It can also indicate that Lean standard work needs to be developed and applied as well as coaching to ensure the sales reps follow the steps in order.
- People: The team size, the makeup and the skill level of the team members may be the cause of the problem. It could also be the level of engagement. People want to feel they are contributing to the success and can make recommendations for improvements that are implemented and celebrated.
- Plant: The physical layout of the office and ability to interact with office staff can also have an impact. For example, can the team in the field connect quickly by phone or internet to get a quick answer to a question for a customer? Is it easy for the sales rep to submit orders?
- Program: This refers to the company software. Is the whole company on the same or integrated software? Do you have support for installation, questions or problems? Is there a cobweb of software creating problems such as errors or delays when the same information has to be entered in different office process software packages?
- Process: This refers to the information, product, or service that is delivered to the customer. Is the sales rep continually putting out fires caused by the product, information or service errors or defects?
Label each bone in the diagram with one of the Ps, then draw arrows or a line and place the problems in the correct category. Then apply the 5 Whys. The 5 Whys is a Lean tool that you can easily implement. It forces the team to peel away the layers to get to the root cause of the problem without additional statistical analysis. When applying the 5 Whys, be sure to formulate good questions as unless you ask the right question, you don’t get the right answer to solve the problem. Here is a fun example of the 5 Whys questions and responses:
Problem: I got an F on my report card in English
- Why did you get an F in English?
- I didn’t turn in my book report on War and Peace
- Why didn’t you turn in your book report?
- My dog ate it
- Why did your dog eat your book report?
- I left it on the floor where I was watching television
- Why did you leave your report on the floor?
- I got distracted by the TV show
- Why were you distracted?
- I haven’t learned to focus and do one thing at a time rather than multi-task
Now you are at the root cause. You have to practice being mindful and concentrate on the major task at hand.
Value-Add, Non-Value Add, and Non-Value Add but required to do Business
The next step in the analysis is to identify the value, non-value, and non-value but required to do business steps in the sales process. You created a value stream map in the measure step and determined the time for each step. Now it is time for both management and sales reps to be completely honest about what is occurring in each step and the associated time. Next, the team must analyze each activity and determine if it adds value for the customer. If it is a non-value item, is it something that does not add value for the customer but is necessary to do business? Examples of non-value but necessary are the maintenance of resources, software upgrades, and employee training.
Once the team identifies the non-value items, they can brainstorm why those activities are included in the process. Team members can then work on eliminating them or initially reducing them. When you remove waste, it may mean that the team will have to restructure the elements within each step of the process. Creating target improvements and a future sales process will help the team eliminate wasted steps and see the value of the improvements. Again, it is critical to your success to celebrate the improvements and the efforts put forth by the team to achieve them.
Steps in the Sales Process
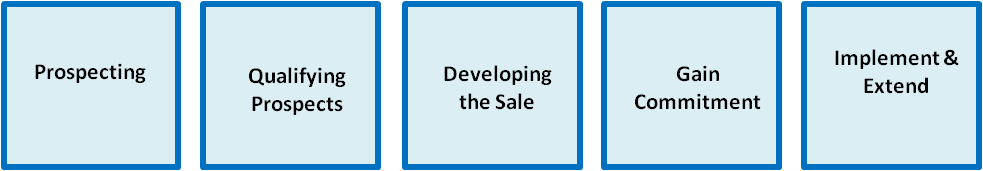
Calculation of Sales Process Efficiency
Establishing the baseline metrics and consistently monitoring them will help you know where you are and then how far you have come since starting to apply Lean to sales. Each problem and cause will yield surprising results. Ensuring that sales receive qualified prospects will eliminate wasteful time spent in the development step. Removing waste will reduce costs, give reps more time with prospects, and reduce the time and cost of each sale. Easy metrics such as days in each step or percentage of leads closed will give a good picture of the improvements.
Summary
Remember Lean is not a one-time fix. It is a journey of continuous improvement. Many companies achieve an initial level of success and think they are fixed. However, it is easy to fall back into old habits and processes. Building a Lean culture, sustaining improvements, and continuously seeking out ways to improve are activities that are everyone’s job. Experiment, run pilots to test your improvements and enjoy the journey!
Get started with these resources:
Liker, Jeffery K, (2004). The Toyota Way: 14 Management Principles from the World’s Greatest Manufacturer. New York: McGraw-Hill.
George, M., Rowlands, D., Price, M., Maxey, J. (2005) The Lean Six Sigma pocket toolbook: a quick reference guide to nearly 100 tools for improving process quality, speed and complexity. New York, N, Y: McGraw-Hill
About the Author: Phyllis Mikolaitis is a sales coach, author, and speaker with over 30 years’ global experience. She is dedicated to taking you beyond the typical “how to” courses to the heart of persuasion techniques incorporating insights and stories to win the sale. Phyllis has also had training in Leadership Through Quality, Six Sigma and Lean. She is certified in Process Improvement in Print and is now working with organizations on Lean and People-Centered Leadership. Visit Phyllis and her business partner John Switzer on other pages on this site www.salestrainingsolutions.com. The links on our website allow you to listen to our podcasts or catch up on past blog posts. For Lunch and Learn sessions, face-to-face or virtual training and coaching contact us at 703-819-5872.
![]()
 .
.
EZine Platinum Author
One thought on “How to Analyze the Disconnect in Your Sales Process”
Ah, good old Ishikawa, and his famous Fishbone Analysis. One of the best problem solving tools to get past the obvious and to the unexpected. Great blog!